CME Market Sentiment Meter
Higher returns from algorithmic trading.

A Tool to Make You More Money
The CME Market Sentiment Meter (MSM) was created by 1QBit and the CME Group. It offers new trading insights by putting numbers to market expectations.
The MSM uses settlement data on eight major futures and options markets to estimate the likelihood of price movements. The MSM is based on money-at-risk in the open market, not just chatter and fake news.
Knowing what people are trading far out the curve adds another dimension to analyzing a market. The MSM is a metric with better forecasting and statistics that you can use to make more money from algorithmic trading.
How Does the MSM Work?
The overall attitude of traders toward a particular market—known as market sentiment—is calculated using futures and options settlement data.
Market sentiment is quantified using risk-return curves, which give the probability of price movement. The wider the curve, the more risk there is on the return, and the more anxiety there is in the market.
There is always more than one school of thought by investors toward a given market, especially leading up to big events with uncertain outcomes. Conventional approaches may not take multiple schools of thought into account—missing out on the whole story. The MSM is able to capture market sentiment states that are rare or short-lived yet extremely important to recognize.
The MSM begins with the assumption that multiple schools of thought will always be present, and that most of the time they are similar. When they are different, though, the MSM detects this and infers a risk-return distribution that departs from the conventional bell curve shape.
What Do the Market States Look Like?

Complacent
Rare
Low level of market anxiety
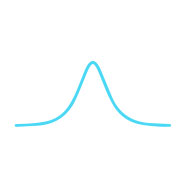
This market state is “calm”, meaning that market expectations are in agreement. The curve is tall and narrow; there is little chance of a large price movement.

Balanced
Common
Normal level of market anxiety
The most common state, this curve has the most typical bell curve shape. It is wider than the Complacent state, which means there is greater risk of a large price movement.

Anxious
Rare
High level of market anxiety
Schools of thought differ even more than the Balanced state and result in a broader curve. The curve may also be skewed off-centre, indicating the direction of a potential price movement.

Conflicted
Extremely Rare
Price gap anxiety
Most unique to the MSM model, the defining feature of this state is its two-peaked distribution. Schools of thought differ the most and may result in large volatility and a large price movement.
Complacent

Rare
This market state is “calm”, meaning that market expectations are in agreement. The curve is tall and narrow; there is little chance of a large price movement.
Balanced

Common
The most common state, this curve has the most typical bell curve shape. It is wider than the Complacent state, which means there is greater risk of a large price movement.
Anxious

Rare
Schools of thought differ even more than the Balanced state and result in a broader curve. The curve may also be skewed off-centre, indicating the direction of a potential price movement.
Conflicted

Extremely Rare
Most unique to the MSM model, the defining feature of this state is its two-peaked distribution. Schools of thought differ the most and may result in large volatility and a large price movement.
How to Get Started
Begin with a free trial package.
Extra Help Getting Started
If you have received an MSM Curated Data file as part of a free trial package and want help in navigating DataMine, 1QBit can assist you.
DataMine Subscribers
If you subscribe to a DataMine product, or have access with a CME ID, you can add the MSM to your subscription via the DataMine shopping cart.
The MSM Covers Eight Highly Traded Futures Markets
Equity Index
CME E-mini S&P 500 futures ES
Interest Rates
CBOT 10-Year Treasury
Note futures TYF
FX
CME Euro FX EUR/USD futures EC
Metal
COMEX Gold
futures GC
Energy
NYMEX WTI Crude Oil futures CL
Energy
NYMEX Henry Hub Natural Gas
futures NG
Agriculture
CBOT Corn futures C
Agriculture
CBOT Soybean
futures S
Equity Index
CME E-mini S&P 500 futures ES
Interest Rates
CBOT 10-Year Treasury
Note futures TYF
FX
CME Euro FX EUR/USD
futures EC
Metal
COMEX Gold
futures GC
Energy
NYMEX WTI Crude
Oil futures CL
Energy
NYMEX Henry Hub
Natural Gas futures NG
Agriculture
CBOT Corn
futures C
Agriculture
CBOT Soybean
futures S
Our Subscription Model is Simple
As low as $80/month per market. Subscribers get preferred access to use-case studies and MSM market research.
Price Package for All Eight Markets
Price per Market
* Yearly subscriptions require payment in full once per year
** Minimum one month will be charged for any one-time historical order
Getting More from the
MSM and the 1QBit Team
1QBit has delivered professional services for Fortune 100 clients in the life sciences, finance, advanced materials, and energy industries.
Much of this work involves breaking new ground. 1QBit’s researchers and developers are experts in a diverse range of fields, including medicine, biology, machine learning, computational physics, chemistry, mathematics, computer science, business, and engineering. 1QBit develops algorithms using concepts and techniques that are applicable across many fields.
As a subscriber, you can work directly with the people who created the MSM. You can also set off exploring in a new direction, taking advantage of the diverse technologies that 1QBit can offer you.
Get more from the MSM and become part of the R&D community at 1QBit.
Contact UsKeep Up to Date with the MSM
See the MSM live in action here.
How to Use MSM Data
Discover more about how the MSM works. 1QBit’s application notes explain how MSM data can be used.
MSM One-Pager
MSM infers market expectations from futures and options settlement data. Conventional models assume that returns on the underlying futures contracts will follow a bell-shaped distribution. In contrast, MSM begins with the assumption that more than one “school of thought” can be present. Most of the time, these schools of thought are similar, and the mixture …..
COVID-19 White Paper
The COVID-19 pandemic had a notable effect on the eight futures and options products tracked by 1QBit’s CME Market Sentiment Meter. In some markets, such as U.S. equity index futures and U.S. interest rate futures, there were rapid increases in daily futures volumes as prices changed and traders managed their evolving risk…
Gold
White Paper
Periods of Anxious market states for COMEX Gold futures (GC1) tended to be either short-lived or long-lived in the eight-year period ending in December 2019. In 2018, the U.S. saw economic growth and the Federal Reserve hiked rates four times during the year. The year was dominated primarily by Balanced market states, and GC consistently fell once the rate hikes were announced…
Crude Oil White Paper
In the year 2019, daily settlement prices (most active expiry) for WTI Crude Oil futures (CL1) rose as tensions with China and Iran grew from January to April. During this period, the Market Sentiment Meter (MSM) indicated Balanced market states. Following a period of Conflicted market states in May, CL fell from 63.21 USD/bbl to 51.14 USD/bbl…
Natural Gas White Paper
From late 2013 through early 2014 there were severe cold fronts across North America, during which time natural gas futures (NG) prices spiked, peaking in February of 2014. The Market Sentiment Meter (MSM) indicated Complacent and Balanced states before the cold period…
Trading Algorithm Navigation White Paper
The CME Market Sentiment Meter (MSM) provides a daily risk–return estimate for eight products traded on CME Group exchanges: corn (C), crude oil (CL), euro/USD FX (EC), S&P 500 index e-minis (ES), gold (GC), natural gas (NG), soybeans (S), and 10-year treasury notes (TYF)…
For more information, contact us.
Disclaimer:
The information within this communication has been compiled for general purposes only. 1QBit assumes no responsibility for any errors or omissions. Additionally, all examples in this communication are hypothetical situations, used for explanation purposes only, and should not be considered investment advice or the results of actual market experience.
Registered trade-marks and service marks are used with the permission of their respective owners.
1QBit
1285 West Pender Street, Unit 200
Vancouver, BC
Canada, V6E 4B1
T: +1 (646) 820–8865
