The US elections are held on the first Tuesday of November, and campaign-related events are widely covered in the news. These events generally have an impact on various US markets as the winning candidate’s policies and viewpoints are very likely to tangibly affect many aspects of US operations going forward into the candidate’s term.
“As November of 2020 approaches, the question remains: are the US Treasuries following a previously seen pattern? If history is a guide, there should be a shift in market sentiment during the election season.”
Events that occur in October can greatly influence the results of the election simply because they happen at a time leading up to an election. The term “October surprise” refers to these types of events.
Quantifying market sentiment surrounding an October surprise
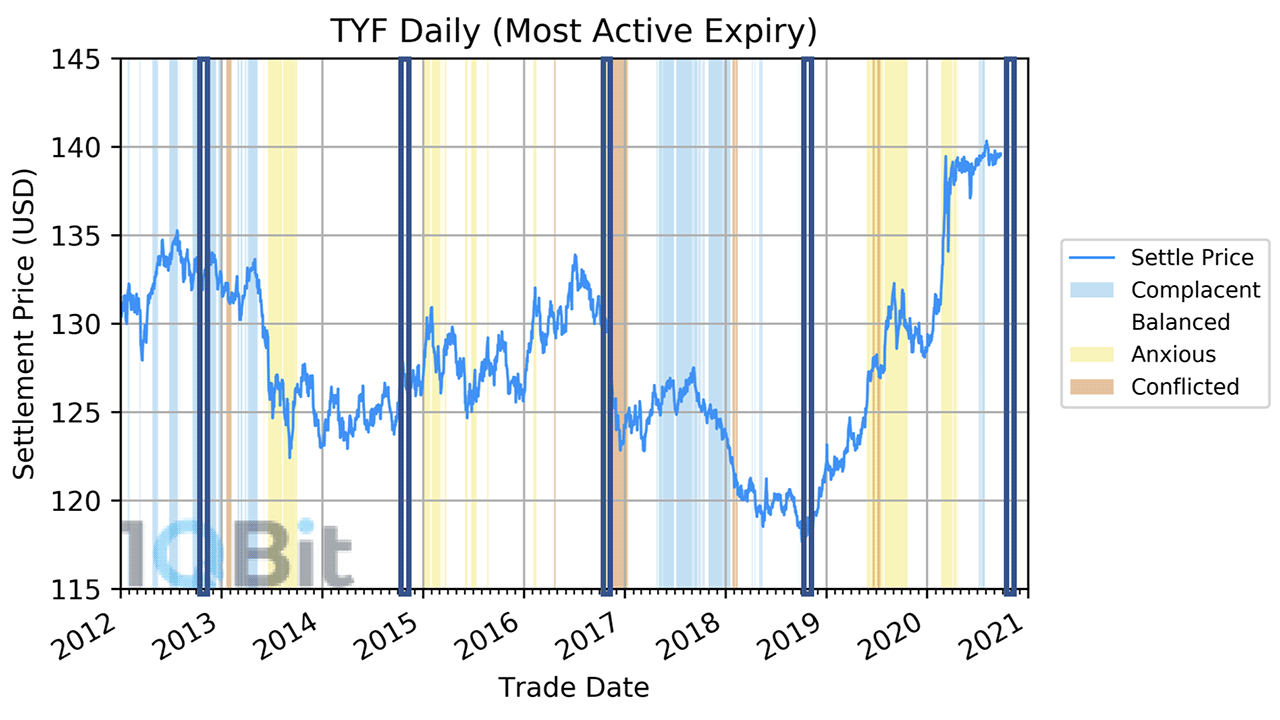
It is possible to quantify market sentiment, that is, the overall attitude of investors toward a particular financial market. The CME Market Sentiment Meter (MSM) can provide insights into this phenomenon by looking at the market states for 10-Year Treasury Note futures leading up to the election. The crux of the analysis is that years that involve presidential and midterm elections affect market sentiment (see Figure 1).

Figure 1: Settlement price for 10-Year Treasury Note futures (TYF) as a function of time overlaid by market sentiment. The dark-blue vertical boxes show where an October surprise happens, or should happen, in relevant years.
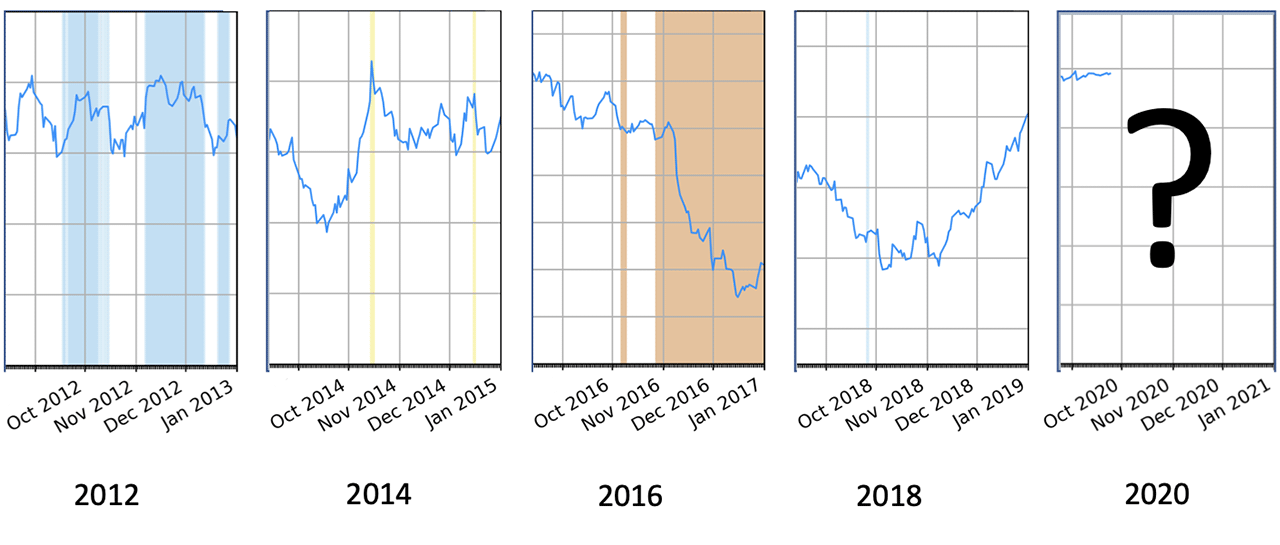
The level of faith that people have in the US economy can be gauged by government bonds, and traders invest accordingly. To provide an example, leading up to the 2012 presidential election, one October surprise came in the form of Hurricane Sandy, where Republican New Jersey Governor Chris Christie lauded the response of the Obama administration despite being a well-known critic of the president. The MSM shifted from being Complacent (i.e., a “calm” market state) to being Balanced (i.e., a “risky” state). Following the election results, the market state shifted back to being Complacent, and the settlement price remained relatively steady.
Similarly, leading up to the 2016 presidential election, there was a series of October surprises that cast a negative light onto both candidates. This caused uncertainty in trader sentiment. As a result, the MSM risk–return curve was broad, and went from Balanced to Conflicted—an even riskier state. Following the election, the MSM consistently indicated a Conflicted market state and the 10-Year Treasury Note futures fell, reflecting trader sentiments about the US economy under the Trump presidency.
What does this mean for the upcoming election?

Figure 2: Settlement price for 10-Year Treasury Note futures as a function of time, overlaid by market sentiment surrounding October Surprise events.
Figure 2 shows snapshots of settlement price surrounding October surprise events. As November of 2020 approaches, the question remains: are the US Treasuries following a previously seen pattern? If history is a guide, there should be a shift in market sentiment during the election season.
Should there be an October surprise this year, the MSM should serve to be especially enlightening. As with the 2016 election, the result could have a significant effect on trader sentiment regarding the strength of the US economy going forward. The MSM serves as an economic gauge, which could be especially important considering the ongoing effects of the COVID-19 pandemic.
CME market states are updated daily, and can be tracked on the CME group MSM page. To learn more about how the MSM works, visit the 1QBit page on the MSM. To set up a free trial and gain access to the MSM, please contact msmsales@1qbit.com.


