Options contracts are more popular than ever, with more options contracts traded last year than any other year in history.1 With people spending more time at home due to the COVID-19 pandemic, many are turning to trading and investing their new surplus of time and money. Brokers have eliminated previous barriers in options trading with smaller fees, increased usability, and the elimination of required minimum account balances to trade options.
“The [CME Market Sentiment Meter] provides data that can help you reduce the risk of losing money in options trading by giving insight into how traders are feeling.”
An options contract is the right—without the obligation—to buy or sell an underlying asset by a future date. The right to purchase is called a “call” option, and the right to sell is called a “put” option. The seller need not hold a position forever. An option can be bought or sold at any time before expiry. But, whether anyone will be there to sell when the original seller wants to buy it back is a big question in options trading.
Gaining Insight into Options Popularity
As an example, consider the popularity of the E-Mini S&P 500 Options (EZ) in the second quarter of 2017, shown in the figure below. The two-year period from January, 2016 to January, 2018 has been chosen for this example due to the variety of market states.
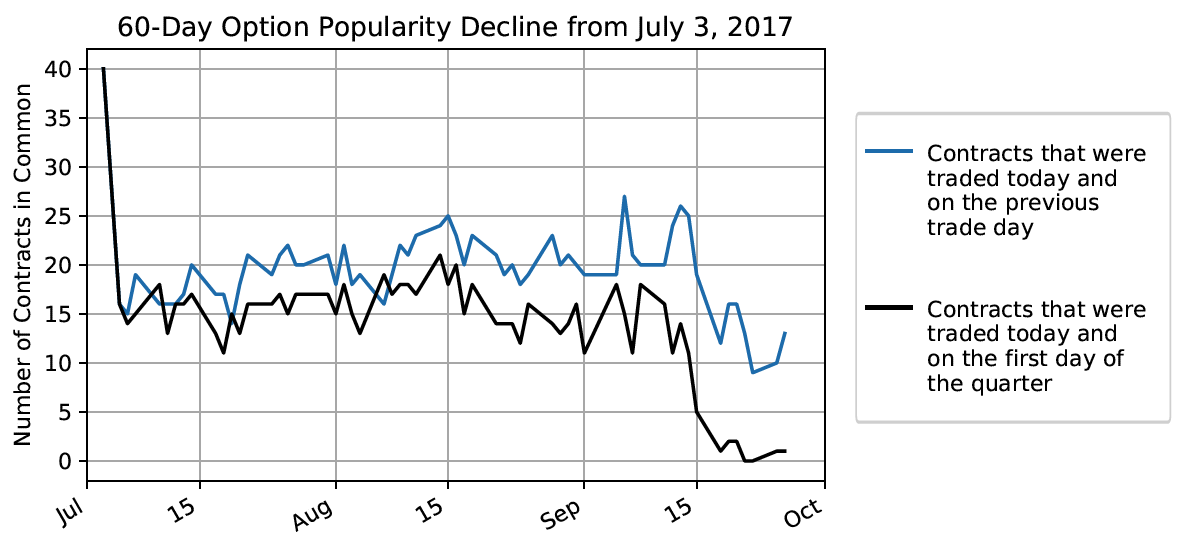
The most popular puts and calls are identified using daily traded volume. In the above figure, popularity is measured by the number of traded contracts shared between a given day and the day preceding it (shown in blue), as well as traded contracts shared between that day and the first day of the quarter (shown in black). This can give insight into demand and how long a trader should hold on to an options contract to make profit.
The 40 most popular contracts on the first day of a given quarter were chosen. Almost all options contracts lose their popularity after 60 days, as shown by the black curve dropping from 40 to almost zero. However, the decline in options popularity is not constant.
We can generally say that only about half of the options that are popular today will be popular tomorrow, as shown by the blue curve hovering around 20 contracts throughout the 60 days. Sometimes, though, this is because of options falling out of popularity and then becoming popular again.
The insight gained in this example by itself is not enough to plan a trading strategy. For how long does a popular option stay popular? And, for how long can a position be held if one hopes to exit before expiry and still make a profit? Patterns can be studied in past end-of-day settlement data to address these questions. By using CME Market Sentiment Meter (MSM) data, a trader can better estimate the likelihood of a popular option remaining popular.
Examining the MSM Market States Compared to Options Popularity
In the figure below, the MSM state and the settlement price for the most active E-Mini S&P 500 Futures (ES) contracts have been overlaid on a sequence of EZ options popularity plots.
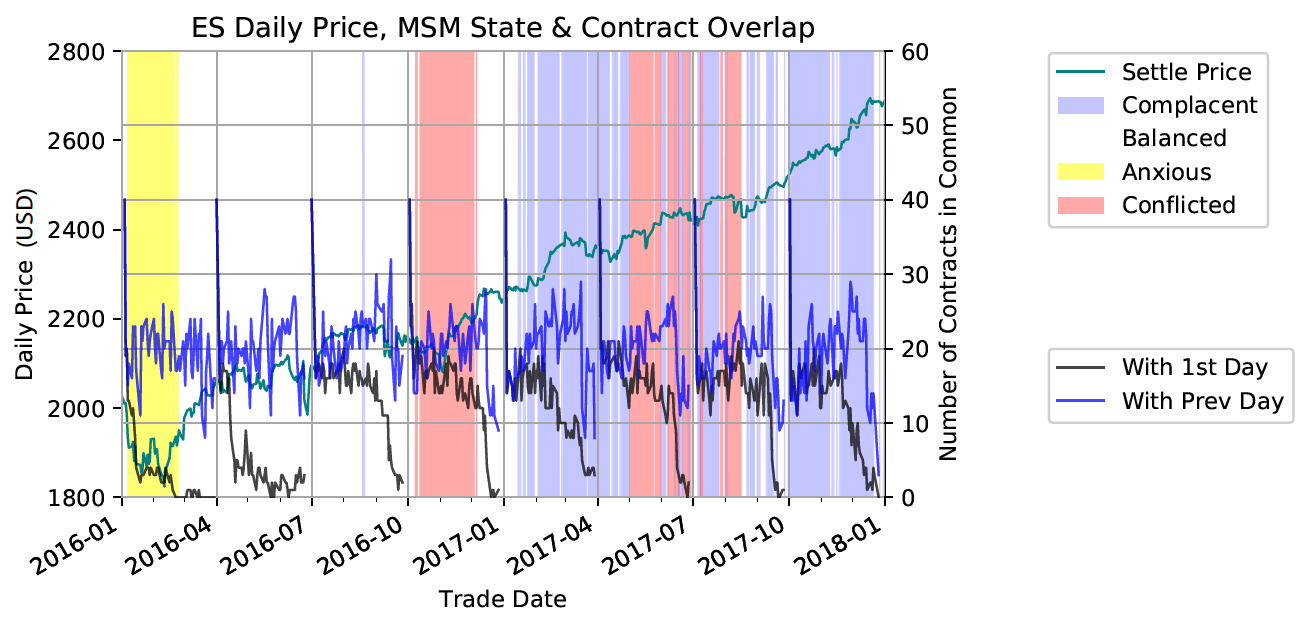
Balanced: represented by a medium bell curve, the most common state indicating a normal level of market anxiety
Anxious: represented by a wide bell curve indicating a high level of market anxiety
Conflicted: represented by a double-peaked bell curve, indicating differing opinions and a price gap anxiety
The period from January, 2016 to January, 2018 illustrates all four MSM states. Although, at a glance, the overlays may seem complex, one can see an association between Complacent states and a slower falloff in options popularity.
Note that the Anxious and Complacent market states are extreme states. In fact, from 2012–2020, neither state occurs more than 20% of the time. Such states are more useful in telling us not to trade instead of trading using any particular strategy.
In general, the MSM provides data that can help you reduce the risk of losing money in options trading by giving insight into how traders are feeling. Further analysis must be done before quantitative correlations between MSM market states and the falloff in options popularity can be turned into a profitable trading strategy. In the meantime, 1QBit has published a number of articles describing how to use the MSM.
For example, in the white paper “Trading Algorithm Navigation Using a Mixture Distribution Risk Model”, it is described how the MSM can be used to “navigate” an existing algorithm across changing market states into a more profitable regime. There is an accompanying 1QBit Blog article that explains how to “Improve Your Trading Algorithm Profitability”.
For more information on the MSM or to set up a free trial, please contact us at msmsales@1qbit.com.