The COVID-19 pandemic has changed the world forever, and its effect will continue to send shockwaves through many parts of society, notably among the world’s financial markets. These include the eight commodity futures and options products tracked by the CME Market Sentiment Meter (MSM): S&P index futures, US Treasury note futures, crude oil, natural gas, corn, soybeans, the Euro/USD exchange rate, and gold.1–3 The MSM is a computational tool that calculates market sentiment with respect to the above futures and options products based on the assumption that their prices and volumes reflect the aggregate sentiments of traders. Asset managers need information that helps them to avoid risks and earn higher returns, even though day-to-day fluctuations are usually small relative to the total value of the instruments being traded.
Indicators on highly traded futures contracts are valuable. In fact, the value of the futures contracts traded at CME Group can be orders of magnitude larger than the value of a given underlying physical commodity. For example, daily US oil consumption is 20M barrels and there are 2.5B barrels of oil traded in futures contracts.
Originally, the MSM was developed to study futures and options data in advance of events, where the timing was known but the outcome was not (e.g., elections, referenda, and economic announcements). In contrast, the COVID-19 pandemic came as a surprise, but since it delivered such large shocks to a great number of linked markets, it was possible to observe the flow of information and the responses of market participants in an unprecedented way.
The conventional approach to studying financial markets is to imagine that short-term price movements can be modelled as a single random process, where the market can be characterized with a small number of descriptive parameters. However, the conventional approach may fail, for example, when crude oil prices went negative on April 20, 2020.4
In contrast, the MSM assumes that there are multiple processes, and that different groups of market participants see things differently. For instance, futures traders are focused on prices in the underlying physical market, and options traders are focused on price movements in the futures contracts themselves. Further, options prices and volumes reflect the aggregate expectations of traders, but more than one set of expectations may be present. The sizes and shapes of these datasets are grouped into patterns, and these are used, in turn, to define market sentiment states. A set of expectations is referred to as a “school of thought”. The MSM cannot predict shocks to a market, but it can indicate the possible evolution of prices after the shocks.
>Broadly speaking, when an important event comes to the attention of a futures market, the first response appears in the underlying futures product. Only after some time do the traders take positions in the corresponding options, which the MSM used to infer their aggregate sentiment.
The Four Market States of the MSM
There are four MSM states: Complacent, Balanced, Anxious, and Conflicted. Each state has a characteristic shape in its distribution of the risks (negative) and returns (positive) that market participants consider to be possible.

Complacent
The Complacent market state is a ‘‘calm’’ state indicating that market participants have few concerns and schools of thought do not significantly differ, resulting in a tall and narrow distribution. The narrow width of the curve is a direct result of a small variance, and generally indicates that there is only a small chance of a large price movement.

Balanced
The Balanced market state is the most common state. This distribution has a typical bell-curved shape with larger variance than the Complacent state, indicating a larger difference in the schools of thought when compared to the Complacent state.

Anxious
In the Anxious market state, schools of thought diverge, and result in a much broader risk–return curve, and may also skew the distribution and move the mean off-centre, yielding information about the direction of a potential price movement.

Conflicted
Most unique to the MSM model is the Conflicted market state. The defining feature of this state is its bimodal (i.e., two-peaked) distribution. For this situation, the schools of thought differ significantly, and may result in large volatility. This may indicate a large price movement.
The Effect of COVID-19 on the First Quarter of 2020
A recent white paper4 describes how COVID-19 affected the eight markets tracked by the MSM. To assist in making comparisons, note that the product codes are those used by CME DataMine, and that the specific trading venues are the four designated contract markets (DCM) operated by the CME Group (NYMEX, COMEX, CBOT, and CME):
- CBOT Corn futures (C) and options (PY)
- NYMEX WTI Crude Oil futures (CL) and options (LO)
- CME Euro/USD FX futures (EC) and options (EUU)
- CME S&P 500 Index E-Mini futures (ES) and options (EZ)
- COMEX Gold futures (GC) and options (OG)
- NYMEX Henry Hub Natural Gas futures (NG) and options (LN)
- CBOT Soybean futures (S) and options (CZO)
- CBOT 10-Year Treasury Note futures (TYF) and options (TC)
In the first quarter of 2020, the MSM indicated a shift from the Balanced market state to the Anxious market state with respect to all of these products, except for soybeans and natural gas. Why are the aggregate sentiments different for these two products?
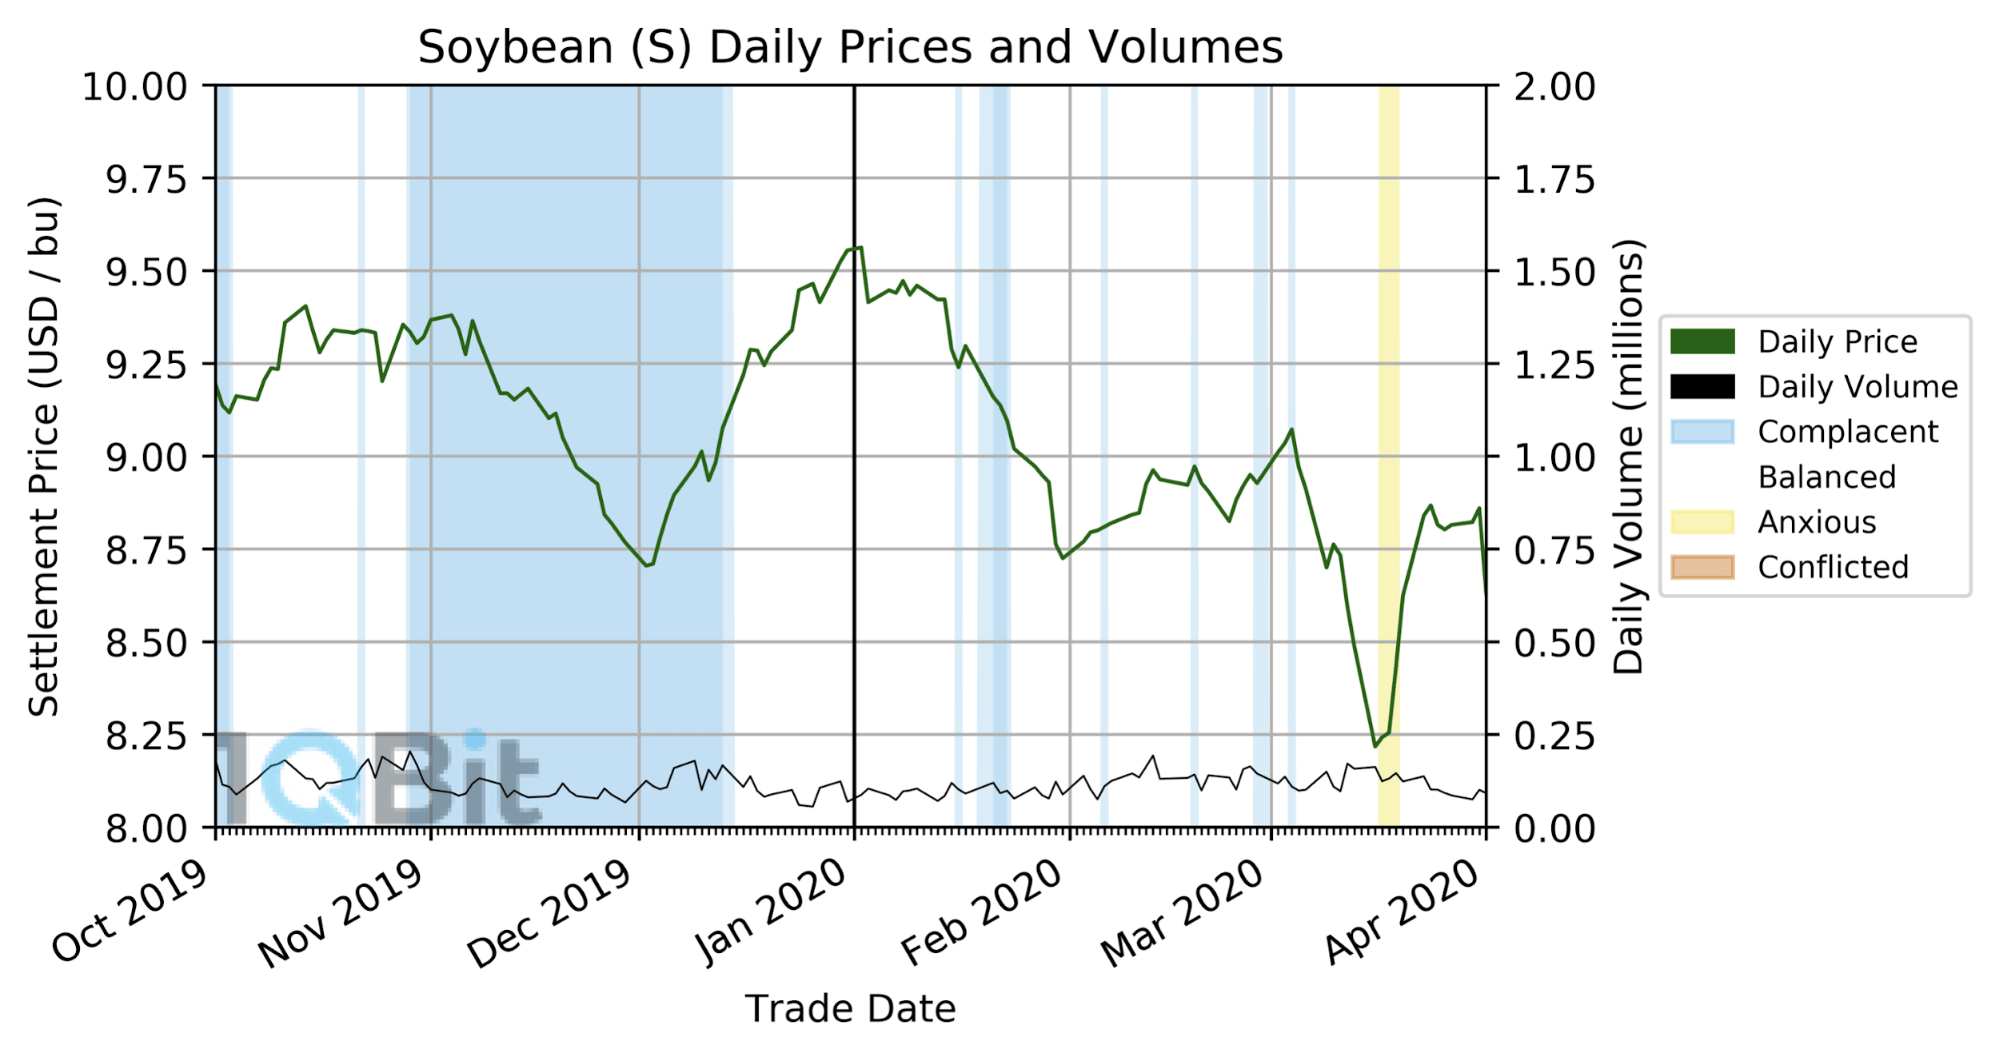
Figure 1: Soybean futures market prices and volumes with associated market states from October 2019 to April 2020.
For the price of US soybean futures, note that China now imports the majority of its soybeans from Brazil, and the US soybean market does not respond to Chinese demand in the way it once did. As a result, soybean futures were mostly in the Balanced and Complacent states, with a brief period of being Anxious beginning in March of 2020; see Figure 1.
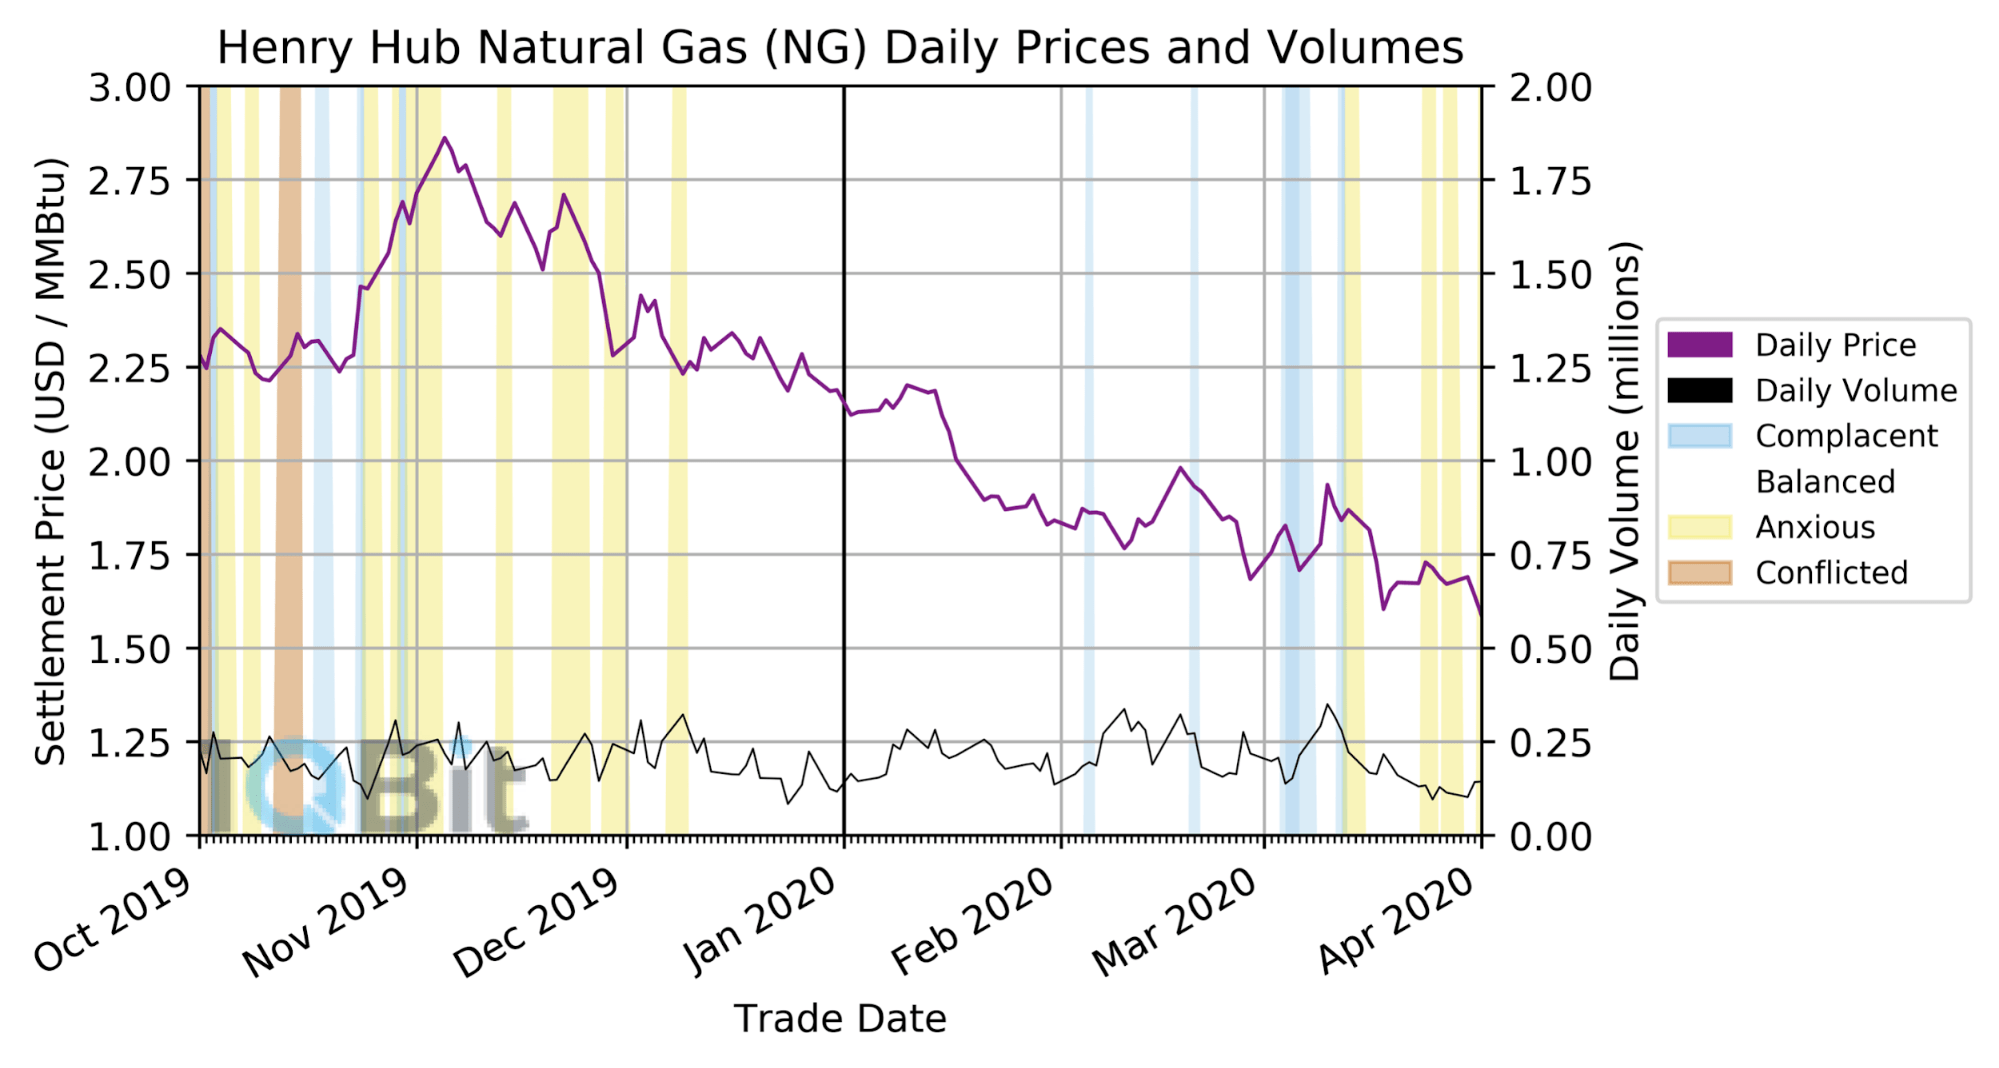
Figure 2: Henry Hub NG futures market prices and volumes with associated market states from October 2019 to April 2020.
The natural gas futures contract used by the MSM is the physically delivered Henry Hub contract. As such, it is largely a US domestic product (i.e., it is not a global benchmark in the same way as WTI crude oil). China and Japan, for example, import natural gas primarily from Australia. Therefore, there is less of a global response to the price of natural gas futures, and the market states are more domestically derived. As seen in Figure 2, natural gas futures rapidly fluctuated between market states leading up to the first quarter of 2020. Then, after a period of Balanced and Complacent market states, there was a trend toward brief periods of Anxious states starting in mid-March of 2020.
For the other six products, there was a clear and consistent shift from the Balanced state to the Anxious state at the end of the first quarter of 2020, as depicted in Figure 3, consistent with the growing impact of the COVID-19 pandemic. This implies that there was an expectation of larger price movements, which were in fact observed in the relevant markets. For example, the volume in 10-year treasury note futures rose sharply to nearly five times the value they had at the start of the year. Yet, within six weeks, this increase had largely subsided. Traders went back to managing their risk through the use of options, but at prices that implied that further movements were likely to occur.
The products that reached the Anxious state have significant international exposure, and they carry information from one part of the world to another.
Further inspection revealed that price movements in the Anxious State were larger than the price movements seen in the preceding Balanced state.
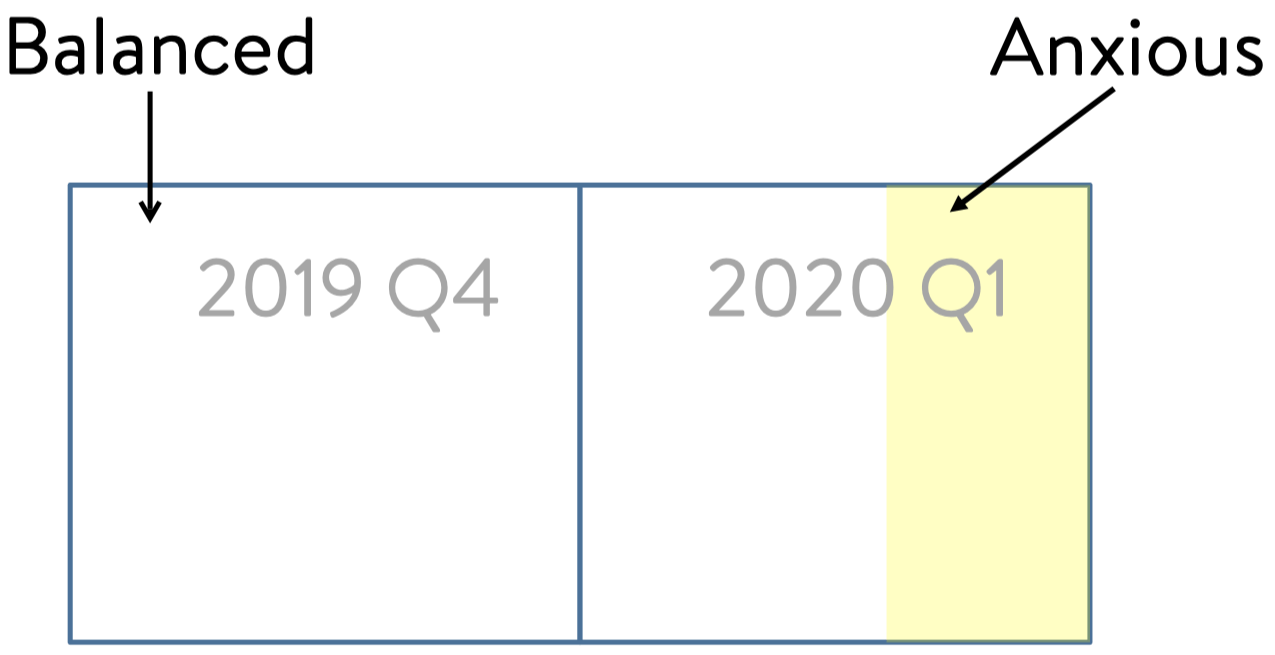
Figure 3: Six futures products (all except soybeans and natural gas) shifted from the Balanced state in the fourth quarter (Q4) of 2019 to the Anxious state at the end of the first quarter (Q1) of 2020.
There was a lag between the reporting of events in the media and a visible response in the futures markets. There was further lag between activity in the futures markets and the establishment of options positions from which aggregate market sentiment could be inferred.
In the case of COVID-19, the lag between the reporting and the responses can be related to the slowly growing awareness that COVID-19 was different from previous outbreaks of infectious disease, and that its economic impact would be felt for some time. It should be noted that effects from COVID-19 were first visible in markets that have significant international exposure. For example, 30% of the gold trading on COMEX is done by traders in Asia, and about a third of US oil is exported to China.
In Summary
Conventional approaches to studying the financial markets involve modelling short-term price movements as a single random process characterized by a small number of parameters. However, these approaches can fail, such as when crude oil prices went negative on April 20, 2020.
In contrast, the MSM assumes that there are multiple processes, and that different groups of market participants see things differently. Forward-looking market activity moves from futures to options in different ways for each product, and at different rates. International trading carries information from one part of the world to another, and is better-represented in some products than others.
The MSM cannot predict shocks to the market, but it indicates the possible evolution of prices after the shocks. The MSM also follows momentum of the market based on historical data, both as a benchmarking tool and in order to predict the aftermath of major events such as the COVID-19 pandemic.
For more information on how the MSM can improve your investments, please visit our page on the MSM.
References
1 1QB Information Technologies Inc., “Subscribe to the Market Sentiment Meter (MSM)”, https://1qbit.com/market-sentiment-meter-msm/, (2020).
2 A. Milne, “CME Market Sentiment Meter (MSM)”, https://1qbit.com/files/msm/MSM_One_Pager.pdf, (2020).
3 CME Group Inc., “Market Sentiment Meter”, https://www.cmegroup.com/tools-information/market-sentiment-meter.html, (2020).
4 A. R. Verma, A. Milne, “Market Reactions to COVID-19”, https://1qbit.com/whitepaper/market-reactions-covid-19/, (2020).