The world is in the wake of the Information Age and computer technology is increasingly improving almost all industries. In finance, for example, algorithmic trading can be more profitable than human trading because of the speed and data processing advantages that computers have over human traders. But not all algorithms are equal. Some perform better than others. In certain cases, there are missed opportunities in which trading decisions could have been navigated from good to better, resulting in greater profit.
“The example we studied, we improved the annualized return on investment from 60% to 135%.”
In a recent white paper, we demonstrated this using the CME Market Sentiment Meter (MSM) and a model algorithm. Our example is drawn from the Natural Gas (NG) futures market, but the same techniques can be applied in all eight of the products that the MSM covers: Corn, Crude Oil, Euro/USD, S&P 500 E-minis, Gold, Natural Gas, Soybeans, and 10-Year Treasury Notes.
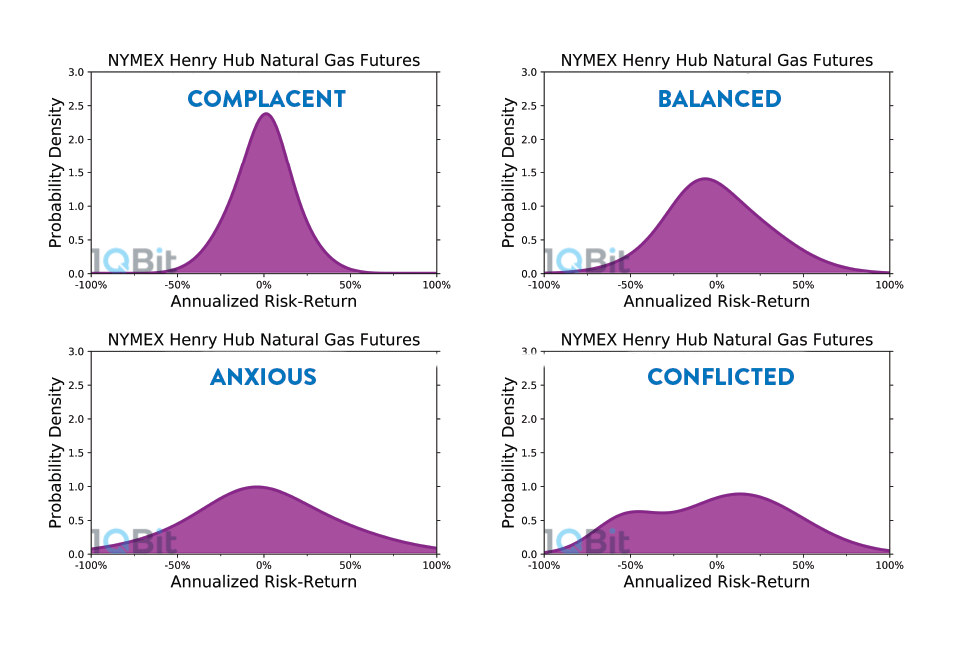
Figure 1: Graphical representations of the risk–return curves for the four market states within the MSM: Complacent, Balanced, Anxious, and Conflicted states.
The MSM provides a daily risk–return estimate based on end-of-day settlement data that can be used to navigate a trading algorithm. This risk–return estimate comes from a multimodal probability distribution that reflects the presence of multiple schools of thought within the trading community (see Figure 1). For more information on the market sentiment states, see our website.
The MSM market states are informative in their own right, but information can be gained from the change of the risk–return distribution over time. How so?
Navigating the Model Algorithm Using the MSM
Navigation is the process of taking some parameter in the algorithm, dubbed the “navigation parameter”, and using other data—in this case the MSM—to steer the output of the algorithm into a more advantageous zone. Navigation works best when we steer an algorithm that already works well.
For our model algorithm—that is, Single Action Mean Reversion Using Lookback (SAMRUL)—navigation is accomplished by fixing the lookback period (the time period to average the settlement price) to a constant number of intervals. However, when we look at how long of a lookback is needed to get the best performance in each of the individual 15-day intervals, we find that choosing wisely can go a long way in picking up the profit and loss (P&L).
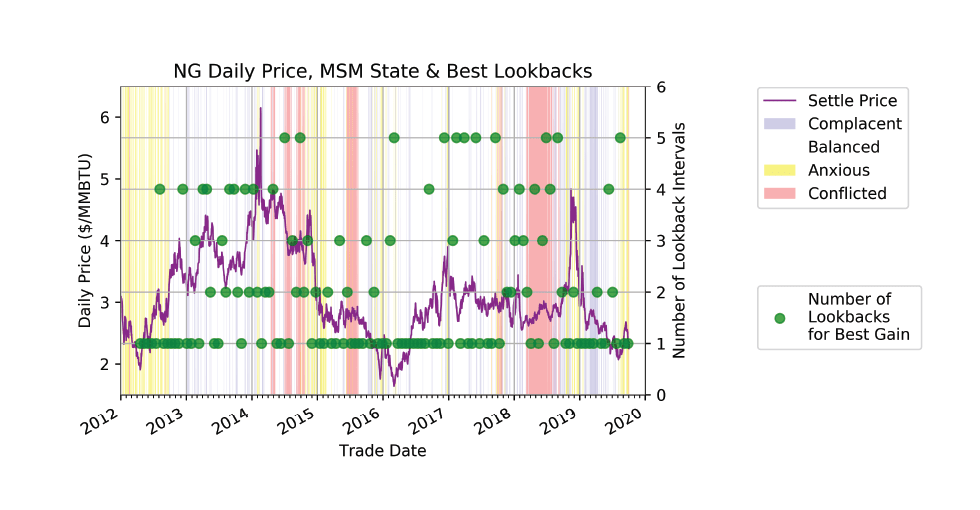
Figure 2: Settlement price for NG (most active expiry) (purple line), the Complacent (blue), Balanced (white), Anxious (yellow), and Conflicted (red) market states, and best number of lookback intervals (green circles).
Figure 2 shows that results are usually best with a single lookback. Yet, there is strong potential for doing better if one could, in theory, always use the best lookback. We call this situation the “crystal ball” best, as if one had a magical crystal ball that allowed for always knowing the right trade decision to make.
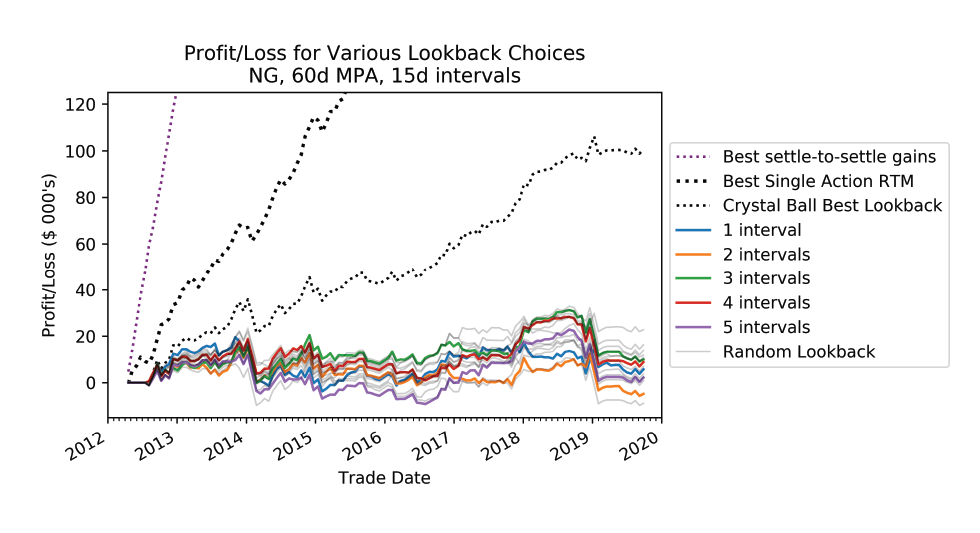
Figure 3: P&L for various lookbacks: three crystal balls, five genuine algorithms, and thirty guesses (random choice of lookback). The vertical P&L scale has shrunk from US$1.2M to US$120,000. The ‘‘Best settle-to-settle” trace and the ‘‘Best Single Action RTM” trace have been left on the chart for comparison.
However, we do not have to predict the best lookback period 100% of the time in order to get better results. In fact, the steering effect does not have to be large to make an impact. In comparing Figure 3 to Figure 4, the small correlation of 26% we achieve is enough to lift the P&L closer to the crystal ball best. The black trace (Declining Anxiety Best) in Figure 4 corresponds to the MSM navigated results. Looking at the dollar P&L and accounting for the rolls and transaction costs, we find that the best constant-lookback algorithm has an annualized return of 60%. Here, the takeaway is that navigation using the MSM increases the annualized ROI to 135% and reduces the worst drawdown.
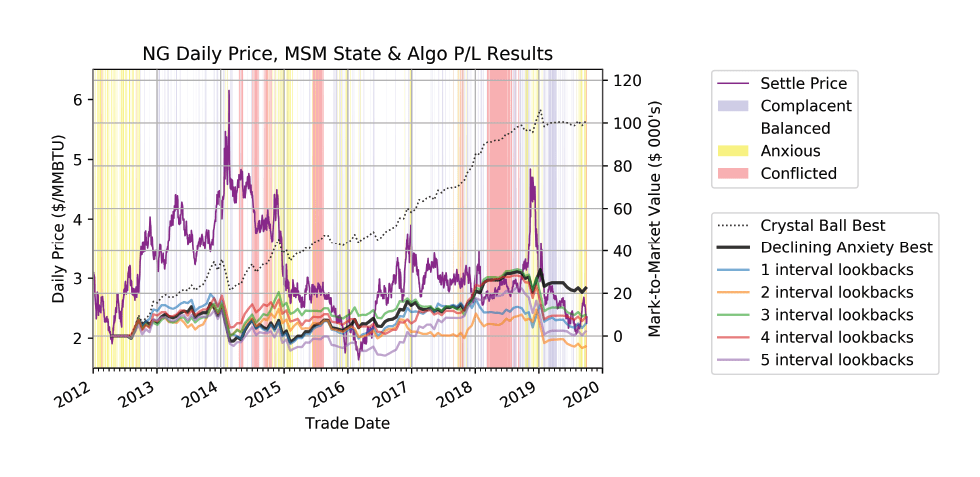
Figure 4: The navigated algorithm delivers the best P&L overall. However, there are areas where a better predictor might have given better results, e.g., in late 2014, where Anxious and Conflicted states were common. The ‘‘Crystal Ball” best represents the upper bound on what SAMRUL could achieve with a ‘‘perfect” predictor.
Navigating Your Own Algorithm
Any trading algorithm can potentially be improved using the MSM data. Many groups use it in their day-to-day operations, including investment banks, pension funds, mutual funds, and hedge funds. Even individuals can make use of the MSM in their trading algorithms. The MSM provides simple and easy-to-use time-series data to improve automated trading systems to draw profit.
Within a trading algorithm, a navigation parameter can be set to a constant value for simplicity, but testing shows that the best value varies over time. In the white paper, we expand on this and describe the intuitive relationship between the length of the lookback period and the choppiness of the market.
The MSM looks for imbalances among different volatilities found in highly liquid futures and options markets. Searching for a navigation parameter should start with the fixed parameters in your algorithm that might be adjusted in response to market volatility. From there, using the MSM becomes a natural choice to help navigate your algorithm into a more profitable zone.
For more information on navigating your own algorithms and how to confirm improvement by means of validation and back-testing, refer to the white paper and the discussion in the book “Advances in Financial Machine Learning”.¹
In summary, the MSM provides data that can make a trading algorithm more profitable by means of a navigation parameter. Using this data, even small improvements to a trading algorithm can result in large returns. In the example we studied, we improved the annualized return on investment from 60% to 135%. Anyone can potentially improve their trading algorithms with the MSM, from large groups down to the individual level. To purchase a subscription to the MSM or to set up a free trial, please contact msmsales@1qbit.com.
References
¹ M.López De Prado, “Advances in Financial Machine Learning’’, John Wiley & Sons, 139–246 (2018).
The information within this communication has been compiled for general purposes only. 1QBit assumes no responsibility for any errors or omissions. Additionally, all examples in this communication are hypothetical situations, used for explanation purposes only, and should not be considered investment advice or the results of actual market experience.