-With-Options-")
When deciding to buy, sell, or hold a particular investment, it can be tempting to simply look at the spot price or volume data and go from there. For those not acquainted with these terms, the spot price of an asset is the current price in the marketplace at which it can be bought or sold for immediate delivery. Volume data quantifies the number of shares traded and, for futures and options, it reveals how many contracts have changed hands.
Futures and options are derivatives of an underlying instrument. A futures contract requires a buyer (seller) to receive (deliver) units of the instrument on a specific future date, assuming the holder’s position is not closed before the expiration date. An options contract gives the holder the right—with no obligation—to buy (or sell) units of the instrument at a specific price at any time, assuming the contract is in effect. Futures, options, and options on futures can be traded in a wide variety of ways.
While it can be helpful to consider these measures an immediate indicator of the state of an asset, it is more useful to consider indicators that give insight into how traders expect the price to move.
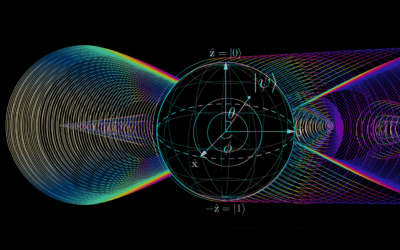
An animation showing futures and their corresponding options prices for eight major markets listed on the Chicago Mercantile Exchange (CME). The lines show how the prices of the futures evolve over time, and the rectangles demonstrate how far into the future options are traded. See here for more information on the futures contracts.
Futures and options data can provide insight into where traders think the price is heading better than simply looking at spot price and volume data; it can be a measure of how exactly traders are betting on price movements.
The above animation shows how far "out the curve" the options contracts are being traded. Notice how some contracts trade further into the future than others. The different trading windows give an idea into how a person may build their trading strategy, as well as the general time scales involved with different markets. It is commonplace to use algorithms to study futures and options data in order to gain certain insights for trading. This is especially useful for huge volumes of data that are just not feasible for humans to analyze. While beneficial, not all algorithmic trading is equal. Some models are better than others, for instance, when quantifying the attitude of investors in a market—known as market sentiment. There is almost always more than one school of thought by investors toward a given market, especially leading up to big events with uncertain outcomes. Conventional approaches may not take multiple schools of thought into account, missing out on the whole story. One tool, the CME Market Sentiment Meter (MSM), is able to capture multiple schools of thought and market sentiment states that are rare or short-lived, yet highly important to recognize. Overall, this can potentially result in making more money in a systematic way from algorithmic trading. To learn more about the MSM, reach out to an expert at msm@1qbit.com, and visit here.Futures and options data can provide insight into where traders think the price is heading better than simply looking at spot price and volume data.