It can be tempting to buy into markets that promise to bring large returns quickly. These get-rich-quick investments are increasing in popularity, but with the possibility of a large gain, there is also the possibility of a large loss.
"Traditional methods of modelling risk can suffer from inaccuracies, which can be seen through two-peaked risk-return distributions found in West Texas Intermediate Crude Oil Futures. Using the MSM, these distributions can be modelled more accurately."
Market risk is commonly modelled as a normal distribution of the expected returns for a financial instrument: The most likely outcome is at the peak, located in the middle of the distribution. The width of the curve on either side of the peak indicates the uncertainty or volatility of the market. Large volatility brings the possibility of making a lot of money, but also the risk of losing a lot of money.
Analyzing normally distributed risk-return distributions is the basis of investment portfolio optimization. Using the simple bell-curve model is a common basis for understanding risk, but it begs the questions: How accurate are these normal distributions? If they are not accurate, is there a better alternative?
Case Study: Visualizing Risk Using Crude Oil
The above questions can be answered by looking at crude oil futures as an example. West Texas Intermediate Crude Oil Futures (CL) is a volatile instrument that trades in high volumes.
Suppose that on January 3, 2010, we asked traders to estimate the 10-year return on CL. It is natural to assume that some of them believe that oil would drop in price, while others believe it will rise in price. Figure 1 is an animation showing what actually happened based on historical data.
Figure 1: Historical returns on oil over a seven and a half year period from 2012–2019.
The accumulated values seem to first trend towards a “bell-shape”, consistent with the normal distribution. But, after a large price drop in the third quarter of 2014, the returns shift downward, and from there a new baseline is established. The longer-term distribution is far from the classic bell shape.
The takeaway: Risk-return distributions are sometimes only bell-shaped for short periods of time.
In Figure 2, the variation in settlement price on CL can be seen from 2012–2021. The price is overlaid on coloured regions that represent different sentiment, or schools of thought, of investors in the market.
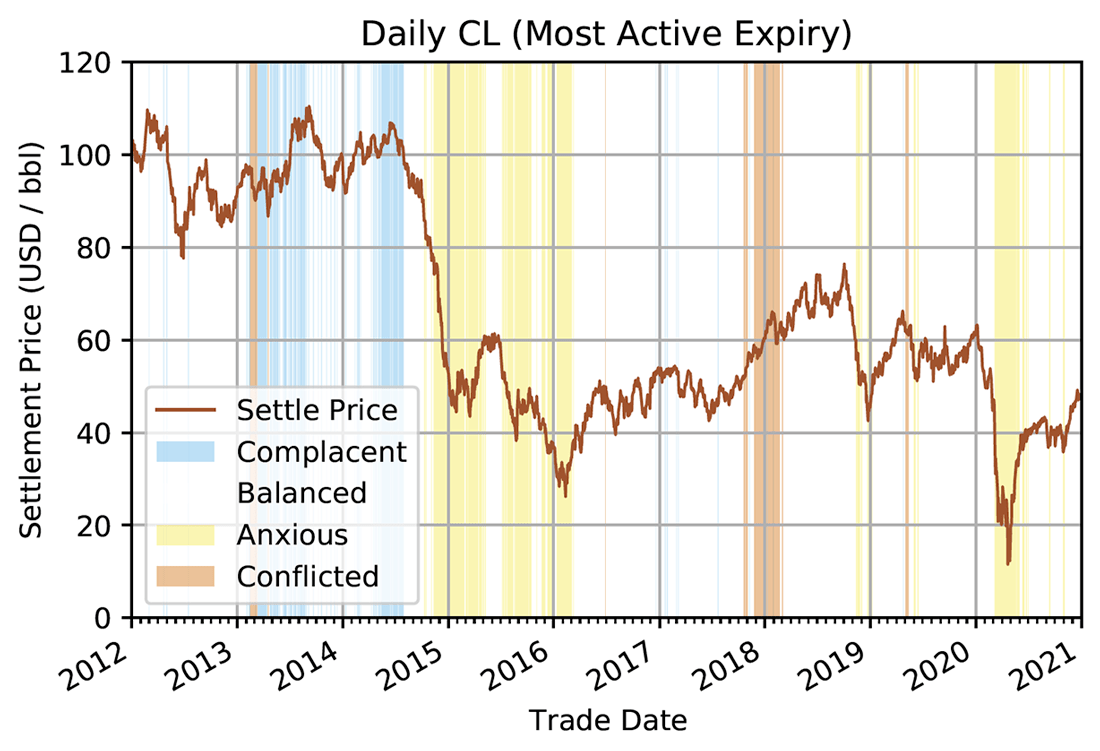
Figure 2: Crude oil futures settlement price overlaid on market sentiment states from 2012–2021.
The CME Market Sentiment Meter (MSM) does not only rely on a single bell-shaped distribution to represent trader expectations. It assumes that multiple schools of thought can be present: If one were to add up the ideas that exist in traders’ minds and express their aggregate sentiment as a risk-return distribution, its shape could sometimes be skewed or more than one peak in the distribution.
In markets known for sudden price movements, the MSM offers a realistic alternative to the conventional approach.
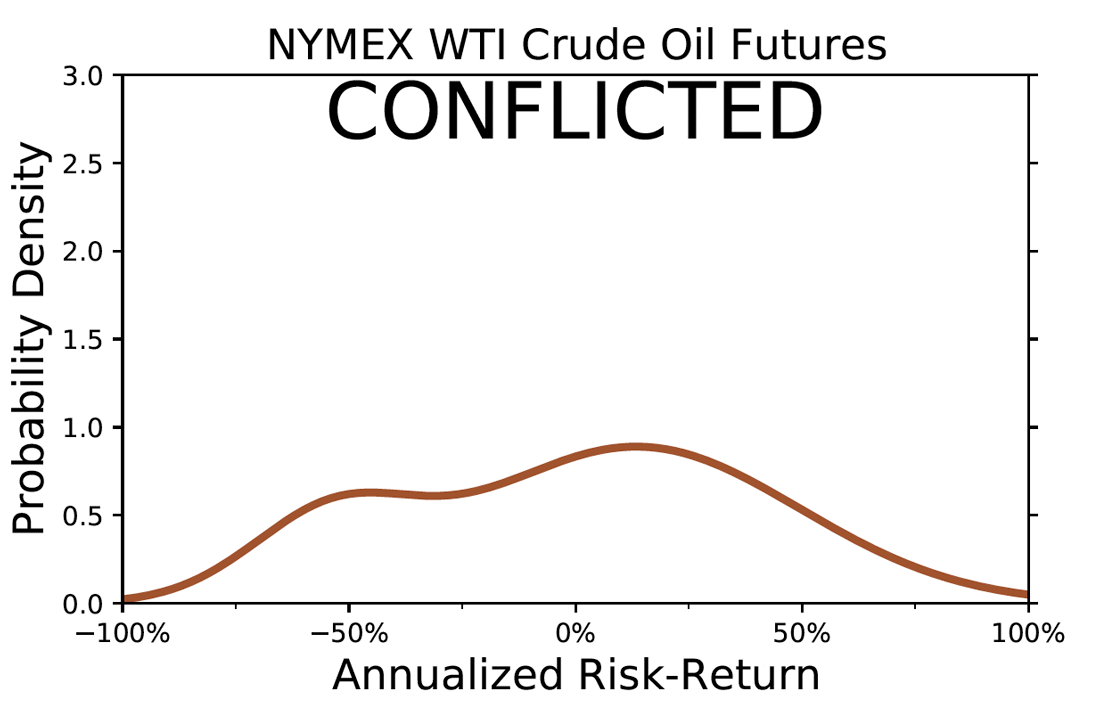
Figure 3: The conflicted market risk-return distribution for CL futures as modelled by the MSM.
As seen in Figure 3, the conflicted market state is visualized as a two-peaked distribution, indicating that there are two distinct schools of thought on expected market price. The large width of the distribution shows that there is a significant chance of large price movements. These more realistic distributions can allow for better analysis of market risk, allowing for safer investment decisions.
Traditional methods of modelling risk can suffer from inaccuracies, which can be seen through two-peaked risk-return distributions found in West Texas Intermediate Crude Oil Futures. Using the MSM, these distributions can be modelled more accurately.
Please visit the 1QBit page on the CME Market Sentiment Meter for more information.
If you are interested in setting up a free trial to explore the MSM for yourself, please contact msm@1qbit.com.